[업무 지식]/Statistics
[오즈비] p-value 실효성 계산
에디터 윤슬
2025. 3. 10. 18:40
https://www.perplexity.ai/page/rojiseutig-hoegwibunseogeul-to-2oqjElr1TgW3DyJSc.6zdQ
로지스틱 회귀분석을 통한 오즈비 및 신뢰구간 계산 방법
import pandas as pd import statsmodels.formula.api as smf import numpy as np
www.perplexity.ai
로지스틱 회귀 모델 적합
import statsmodels.api as sm

# 변수 설정
X = cluster_df[['PCA_Cluster_9', 'PCA_Cluster_2', 'Target_Men', 'conversion_rate', 'join_period', 'shipment_fee']]
y = cluster_df['is_churned']

# 로지스틱 회귀 모델 적합
model = sm.Logit(y, X).fit(maxiter=500)

# 결과 요약
print(model.summary())

# 개별 P-value
p_values = model.pvalues[1:]
significant_vars = p_values[p_values < 0.05].index.tolist()
Optimization terminated successfully.
Current function value: 0.389598
Iterations 8
Logit Regression Results
==============================================================================
Dep. Variable: is_churned No. Observations: 38173
Model: Logit Df Residuals: 38167
Method: MLE Df Model: 5
Date: Mon, 10 Mar 2025 Pseudo R-squ.: 0.3238
Time: 17:45:15 Log-Likelihood: -14872.
converged: True LL-Null: -21995.
Covariance Type: nonrobust LLR p-value: 0.000
===================================================================================
coef std err z P>|z| [0.025 0.975]
-----------------------------------------------------------------------------------
PCA_Cluster_9 0.0061 0.001 10.787 0.000 0.005 0.007
PCA_Cluster_2 -0.0790 0.003 -31.120 0.000 -0.084 -0.074
Target_Men -0.4003 0.036 -11.122 0.000 -0.471 -0.330
conversion_rate 0.0441 0.002 21.568 0.000 0.040 0.048
join_period 0.0071 0.001 10.961 0.000 0.006 0.008
shipment_fee -0.0001 1.41e-06 -75.828 0.000 -0.000 -0.000
===================================================================================
오즈비 변환
# 계수 및 신뢰구간 추출
params = model.params[1:]  # 절편 제외
conf = model.conf_int().iloc[1:, :]  # 95% 기본 신뢰구간

# 오즈비 변환
odds_ratios = np.exp(params)
conf_exp = np.exp(conf)

# 결과 테이블 생성
result_df = pd.DataFrame({
    'Variable': params.index,
    'OR': odds_ratios.values,
    '2.5%': conf_exp[0].values,
    '97.5%': conf_exp[1].values
})
로지스틱 회귀분석(Logistic Regression, lr)
로지스틱 회귀분석은 Logistic regression analysis로 표기하면 로짓분석(Logit analysis)라고도 한다. Cox(1970)가 처음 제시한 개념으로 두개의 값만을 가지는 종속변수와 독립변수들 간의 인과관계를 로지
dine.tistory.com
시각화
plt.figure(figsize=(10,6))
plt.errorbar(x=result_df['OR'], y=result_df['Variable'],
             xerr=[result_df['OR']-result_df['2.5%'], result_df['97.5%']-result_df['OR']],
             fmt='o', color='#2c7bb6', ecolor='#d7191c', capsize=5)
plt.axvline(x=1, color='grey', linestyle='--')
plt.title('Odds Ratios with 95% Confidence Intervals')
plt.xlabel('Odds Ratio (log scale)')
plt.xscale('log')
plt.grid(True, which='both', linestyle='--', linewidth=0.5)
plt.show()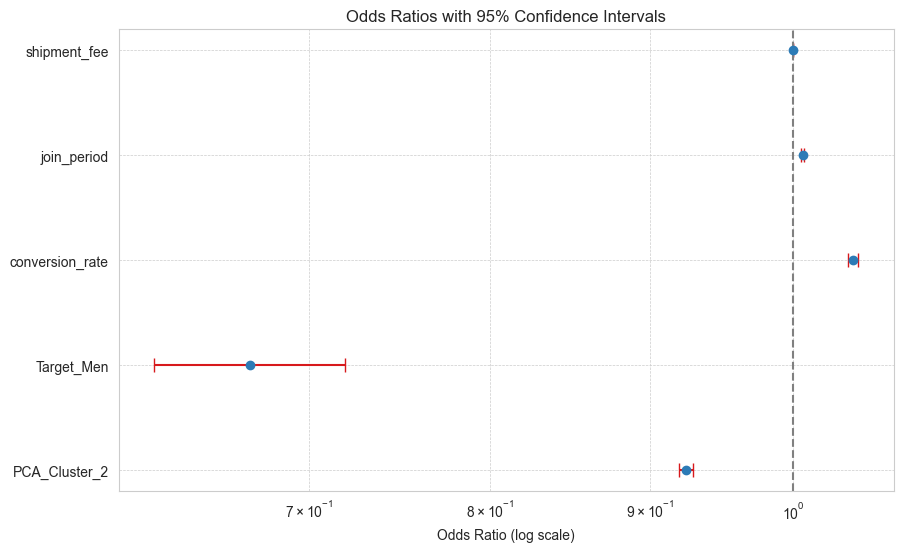
실효성 계산
# 실효성 계산 함수
def calculate_impact(or_value, current_rate):
    return (1 - or_value) * current_rate * 100

# 월간 접속 빈도 효과 계산
current_churn = 0.40  # 현재 이탈률 40%
impact = calculate_impact(0.92, current_churn)
print(f'행동 데이터 1회 증가 시 예상 이탈률 감소: {impact:.1f}%p')  # 출력: 3.2%p


행동 데이터 1회 증가 시 예상 이탈률 감소: 3.2%p